A Bloom’s Digital Taxonomy For Evaluating Digital Tasks
by TeachThought Staff
Learn more in An Introduction To Bloom’s Taxonomy Course by TeachThought University
What makes Bloom’s Taxonomy such a power tool is its flexibility in framing almost anything.
We offered in The Definition Of Bloom’s Taxonomy that the framework is “a hierarchical ordering of cognitive skills that can, among countless other uses, help teachers teach and students learn.” Whether you’re creating a checklist for instructional design, evaluating an assessment, skimming a favorite unit of yours, or using it as a walk-through instrument to get a feel for the level of student thinking in a classroom, Bloom’s Taxonomy is a powerful tool for any educator at any level.
See also Bloom’s Taxonomy (New Edition) Digital Planning Verbs & Cards
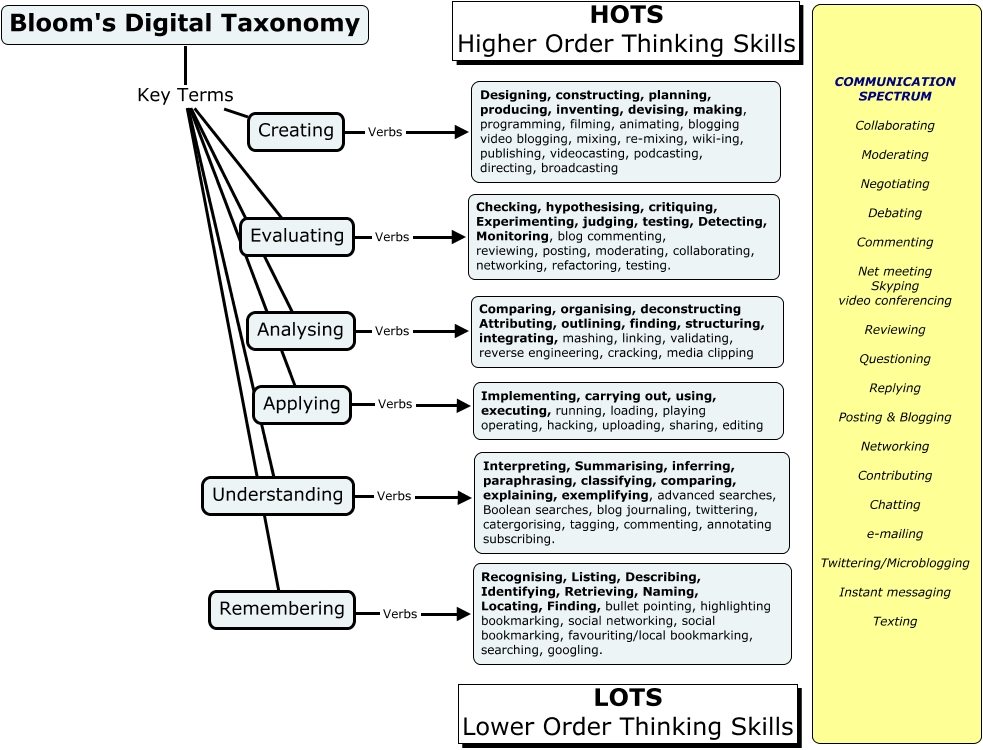
So the following Bloom’s Digital Taxonomy was especially interesting in how it mashes digital tasks–podcasting, blogging, networking, hacking, bookmarking, social media sharing, and so on, with the stalwart learning tool so graciously delivered by Benjamin Bloom. The result is Bloom’s Digital Taxonomy from edorigami’s Wikispaces site. (Update: Wikispaces has since dissolved and the link has been removed.)
One Takeaway
Thematically, this is a chart version promoting technology in learning–or rather technology-infused learning. It clearly suggests the cognitive burden so many common ‘internet’ activities require, helping to visualize what these activities are asking our brains to do when we do them.
The “Communication Spectrum” to the right lists the most common digital communication channels, though it’s either a tad vague or outdated considering the limited discussion of specific social media platforms. Each platform–from facebook to pinterest to and everything in between has subtle differences between them that bear analysis when looking at exactly how we communicate.
While some of the activities could be placed in other categories–hacking, for example, could be in evaluating and creating–the end result is a well-laid out chart that helps demonstrate the potential of properly-designed technology-based learning activities.