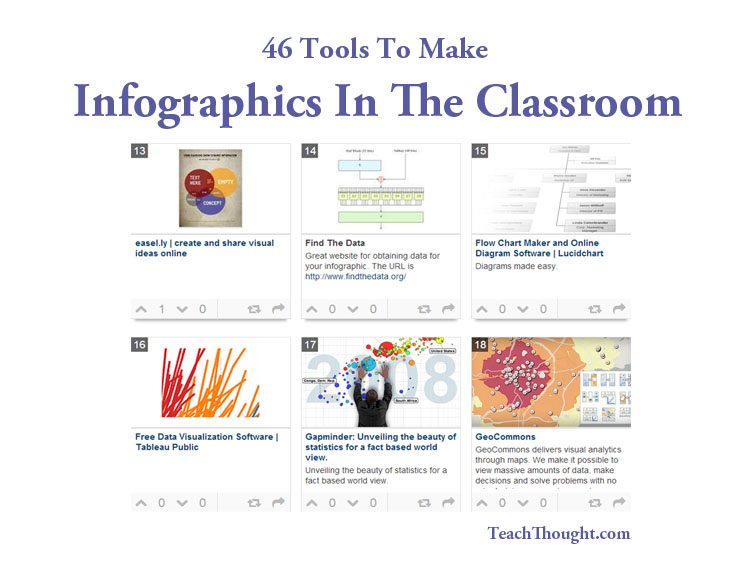
Infographics were a fad in the early 2010’s–an interesting mash of (hopefully) easily-consumed visuals (so, symbols, shapes, and images) and added relevant character-based data (so, numbers, words, and brief sentences).
But in the 2020s, they can still be used for students to demonstrate their learning (especially hesitant writers).
If you want to try to make infographics–or better yet, have students make them–where do you start? And with the sheer quantity and variety–from sources of data and models to tools that create them, you can almost certainly find something to use in your classroom that’s not too pricey, that works for your grade level, and that isn’t blacked by your district’s incredibly frustrating filter.
1. Canva
Canva is a versatile graphic design tool that offers a wide variety of templates, fonts, icons, and images to create visually stunning infographics. It provides drag-and-drop functionality, making it easy for students to customize their designs. Canva also offers a free education version with additional features for educators and students.
2. Piktochart
Piktochart is a user-friendly infographic maker that offers a range of customizable templates and design elements. It provides an intuitive interface and allows students to import data, add charts and graphs, and include icons, images, and text to create engaging infographics.
3. Venngage
Venngage is a popular online tool for creating infographics, reports, and presentations. It offers a wide variety of infographic templates and provides options to customize colors, fonts, and visual elements. Venngage also includes data visualization tools to create charts and graphs within the infographic.
4. Visme
Visme is a comprehensive visual content creation tool that includes infographic templates, as well as options for creating presentations, reports, and other visual content. It offers a drag-and-drop interface and features to animate and interact with elements in the infographic. Visme also provides data visualization options and collaboration features.
5. Adobe Spark
Adobe Spark is a free tool that allows students to create professional-looking infographics, videos, and web pages. It provides a simple interface and a range of design templates, fonts, and images. Students can easily customize the templates and add their own content to create visually appealing infographics.
6. Google Slides
While Google Slides is primarily a presentation tool, it can be used to create simple infographics by leveraging its features. Students can utilize the shapes, text boxes, and image insertion options in Google Slides to design their infographics. It also allows for collaboration and easy sharing with others.
7. Infogram
Infogram is a data visualization and infographic tool that offers a wide range of charts, maps, and infographic templates. It provides an intuitive interface for creating interactive and engaging infographics. Infogram allows students to import data, customize visuals, and easily share their infographics.
