Bloom’s Digital Taxonomy (2025): Levels, Digital Verbs, and AI-Aware Classroom Examples
Summary: A practical update to Bloom’s Digital Taxonomy that aligns cognitive levels with digital verbs and AI-aware classroom applications. Use it to map technology rich tasks to the level of thinking you want students to demonstrate and to design beyond low level digital busywork.
Keywords: Bloom’s Digital Taxonomy, digital verbs, AI in education, lesson design, assessment
What This Page Covers
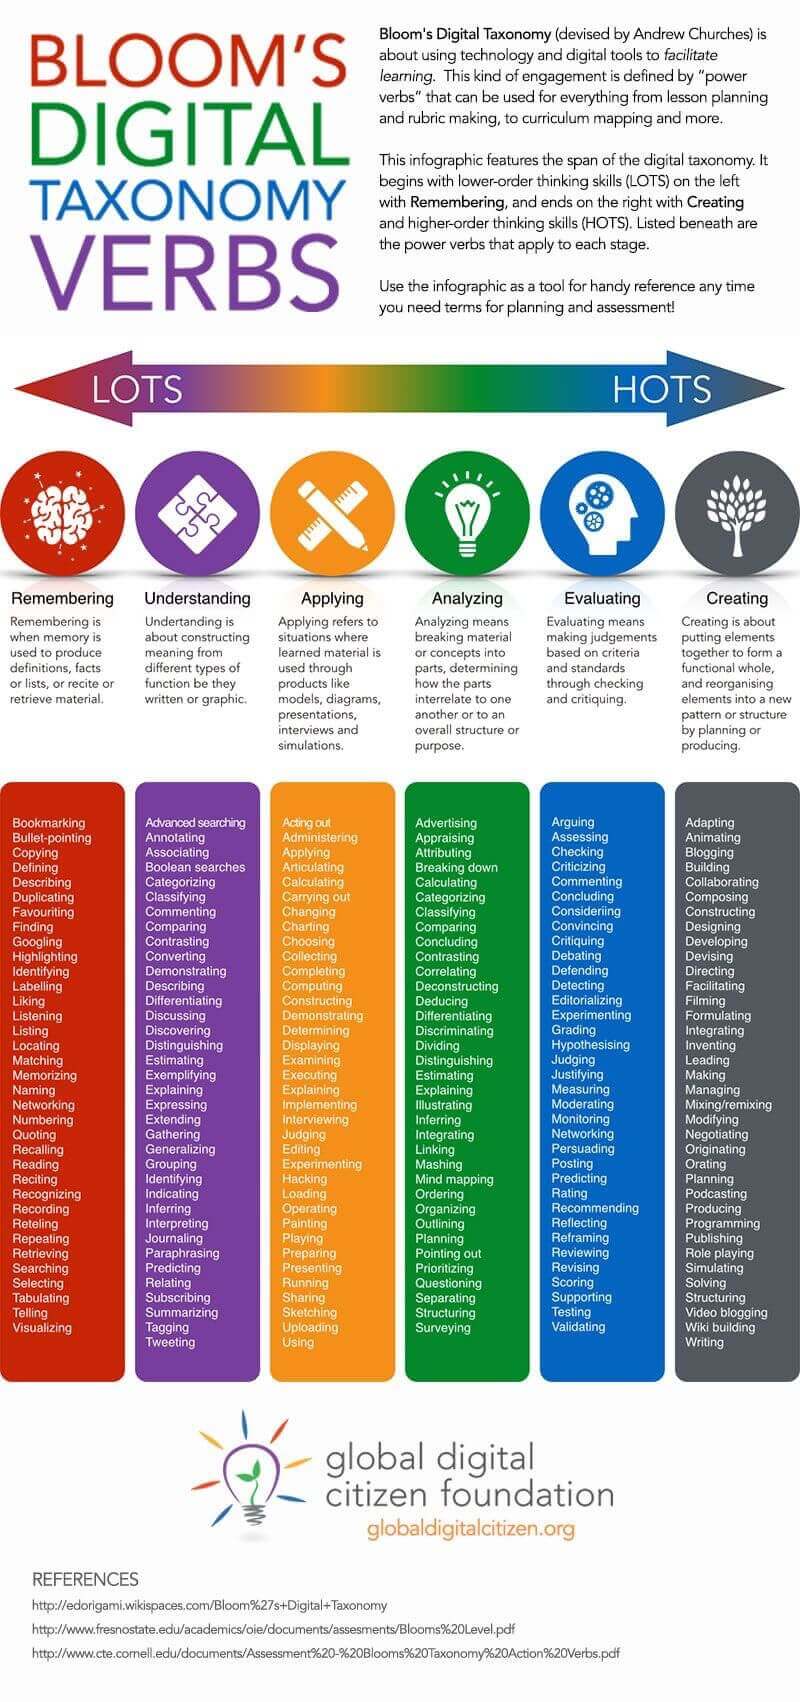
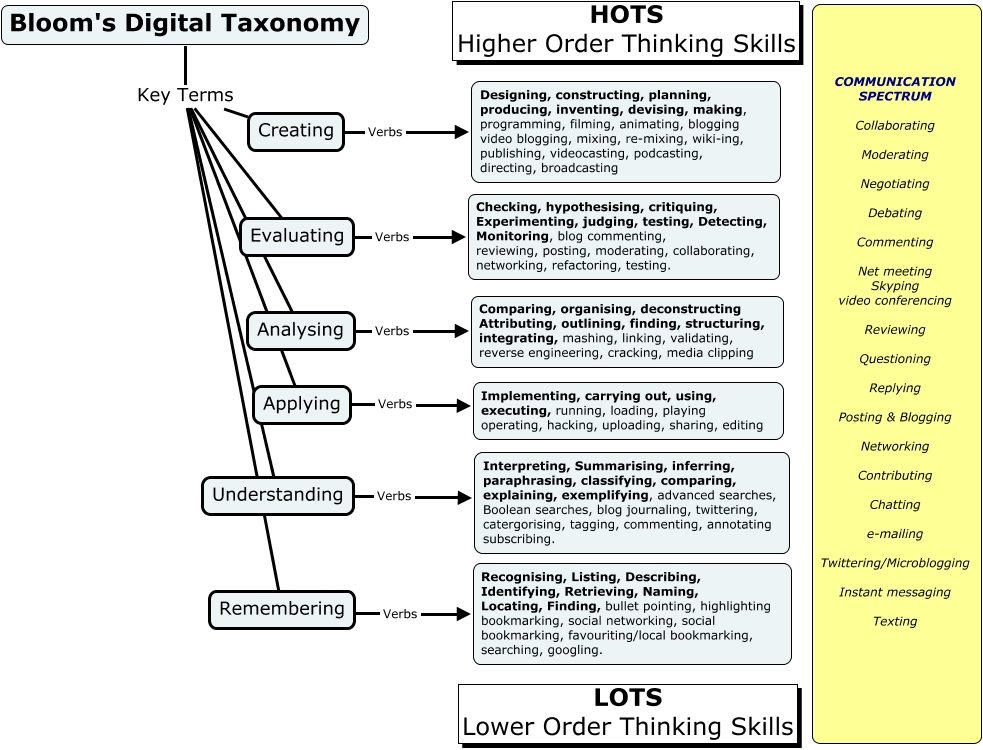
Bloom’s Digital Taxonomy extends the revised taxonomy into technology rich contexts. It emphasizes verbs and tasks native to digital environments and clarifies how AI tools can support, extend, or hinder thinking at each level (Anderson & Krathwohl, 2001; Churches, 2009). Below you will find a quick reference list of digital verbs and level by level examples ready to adapt to your classroom.
For a traditional, non-digital list of verbs by level, see Bloom’s Taxonomy Verbs. If you are newer to the framework, start with What Is Bloom’s Taxonomy, then return here to plan technology-rich tasks. Also see Common Misconceptions About Bloom’s Taxonomy and Alternatives To Bloom’s Taxonomy for nuance and complementary models.
Digital Verbs Quick Reference
Use these verbs during planning to align tasks with the intended level of thinking. Pair with the examples that follow.
Remember: bookmark, tag, subscribe, retrieve, list, locate, capture, screenshot
Understand: comment, annotate, organize, categorize, summarize, thread, react, highlight
Apply: edit, format, prototype, simulate, configure, deploy, record, embed
Analyze: compare, visualize, trace, version, inspect, cluster, query, audit
Evaluate: review, verify, curate, moderate, peer assess, cite, attribute, fact check
Create: compose, code, publish, remix, storyboard, render, prompt, orchestrate
Remember
Goal: recall facts, terms, and basic concepts.
Teacher cues
- Identify, list, define, match, label, recall.
Digital verbs: bookmark, tag, subscribe, retrieve, list, capture, screenshot
AI aware classroom examples
- Create a shared bookmark folder of core sources. Students add captured screenshots and one sentence labels.
- Use a class glossary where students tag terms and retrieve definitions during a timed recall activity.
- With AI, students ask a model to generate five distractor terms mixed with real ones, then identify the correct set and justify choices.
Assessment ideas
- Auto graded recall quiz built from the class glossary.
- Find and label screenshot set with a rubric for accuracy and clarity.
Pitfalls
- Confusing collection with understanding. Require short rationales to show more than gathering.
Understand
Goal: explain ideas or concepts and show comprehension.
Teacher cues
- Explain, classify, summarize, compare, infer, exemplify.
Digital verbs: comment, annotate, organize, categorize, summarize, thread, react, highlight
AI aware classroom examples
- Threaded annotation of a primary source with highlights and short rationales linked to key terms.
- One sentence summaries for each paragraph using your summary frame. Compare interpretations in pairs.
- With AI, students generate two alternative summaries at different reading levels, then critique which preserves meaning best and why.
Assessment ideas
- Annotation rubric that scores selection, accuracy, and insight.
- Concept map scored for correctness and clarity of relationships.
Pitfalls
- AI produced summaries can mask gaps. Require a short “why this is the best summary” reflection.
Apply
Goal: use information in new but structured situations.
Teacher cues
- Implement, perform, execute, solve, demonstrate.
Digital verbs: edit, format, prototype, simulate, configure, deploy, record, embed
AI aware classroom examples
- Configure a science simulation, record a screencast walk through, and explain parameter choices.
- Embed a prototype into a portfolio and add a 90 second voiceover describing how it meets constraints.
- With AI, prompt a coach for setup tips, then document which were used and why.
Assessment ideas
- Checklist for procedural accuracy and evidence of transfer.
- Short oral defense that explains choices and outcomes.
Pitfalls
- Over scaffolded templates can reduce thinking. Keep constraints, not step by step answers.
Analyze
Goal: break information into parts and explore relationships.
Teacher cues
- Differentiate, organize, attribute, compare, deconstruct.
Digital verbs: compare, visualize, trace, version, inspect, cluster, query, audit
AI aware classroom examples
- Version two drafts of an argument and visualize changes. Annotate why each change improves the claim or evidence.
- Cluster sources by claim type and audit credibility signals. Build a table pairing source claim with verification tactic.
- With AI, generate a counter argument outline, then trace weak parts and replace them with evidence from vetted sources.
Assessment ideas
- Rubric for reasoning quality, evidence selection, and structure.
- Side by side before vs after analysis with written justifications.
Pitfalls
- AI may fabricate or over generalize. Require links to sources and a short verification log.
Evaluate
Goal: justify a decision or judgment using criteria and standards.
Teacher cues
- Critique, defend, appraise, verify, prioritize, justify.
Digital verbs: review, verify, curate, moderate, peer assess, cite, attribute, fact check
AI aware classroom examples
- Peer review a class set of infographics using a shared rubric and write a short justification for the top three selections.
- Moderate a discussion by curating the strongest claims and linking each to its evidence and credibility score.
- With AI, run generated claims through a fact checking workflow, then document corrections and final judgment.
Assessment ideas
- Rubric emphasizes criteria selection, evidence quality, and transparent reasoning.
- Short “why this, not that” reflection that defends final choices.
Pitfalls
- Binary right vs wrong judgments. Require criteria first, then apply them visibly.
Create
Goal: put elements together to form a new, coherent product or point of view.
Teacher cues
- Design, compose, construct, plan, produce, author.
Digital verbs: compose, code, publish, remix, storyboard, render, prompt, orchestrate
AI aware classroom examples
- Storyboard and publish a multimedia explainer with citations and alt text for accessibility.
- Create a mini podcast series with show notes that explain how each episode advances the thesis.
- With AI, design an assisted workflow with prompt, draft, peer review, revision, and publish. Turn the workflow into a diagram and explain each decision.
Assessment ideas
- Product rubric plus maker notes that document key choices and revisions.
- Public facing criteria include usefulness, clarity, originality, and ethical sourcing.
Pitfalls
- Over reliance on AI for drafting. Require visible iteration, source logs, and author commentary.
Planning With Digital Verbs
- Start with outcomes. Choose the level first, then select digital verbs and tools that fit the thinking.
- Add constraints, not recipes. Set audience, time, and criteria. Let students design how to meet them.
- Make process visible. Require short maker notes, version history, or verification logs.
- Assess transfer. Ask students to adapt the product for a new audience or constraint and explain the changes.
Bloom’s Digital Taxonomy Graphic

Works Cited
- Bloom, B. S. (Ed.). (1956). Taxonomy of Educational Objectives: The Classification of Educational Goals. Handbook I: Cognitive Domain. New York: David McKay Company.
- Anderson, L. W., & Krathwohl, D. R. (Eds.). (2001). A Taxonomy for Learning, Teaching, and Assessing: A Revision of Bloom’s Taxonomy of Educational Objectives. New York: Longman.
- Churches, A. (2009). Bloom’s Digital Taxonomy. Educational Origami.

