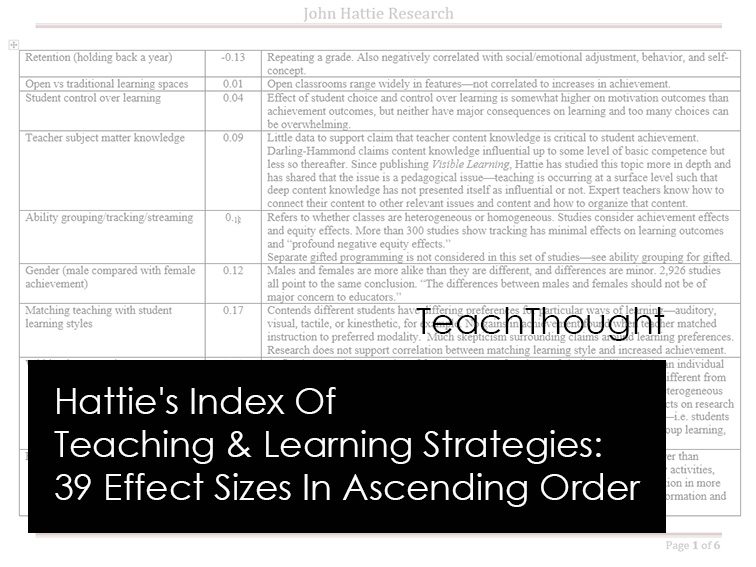
What Is Hattie’s Index Of Teaching & Learning Strategies?
contributed by Dana Schon, sai-iowa.org
Effect Size Defined
Statistically speaking, the strength of the relationship between two variables. John Hattie, Professor of Education and Director of the Melbourne Education Research Institute at the University of Melbourne, Australia, says ‘effect sizes’ are the best way of answering the question ‘what has the greatest influence on student learning?’
Effect Size Applied
- Reverse effects are self-explanatory, and below 0.0
- Developmental effects are 0.0 to 0.15, and the improvement a child may be expected to show in a year simply through growing up, without any schooling. (These levels are determined with reference to countries with little or no schooling.)
- Teacher effects “Teachers typically can attain d=0.20 to d=0.40 growth per year—and this can be considered average”…but subject to a lot of variation.
- Desired effects are those above d=0.30 (Wiliam, Lee, Harrison, and Black 2004) and d=0.40 (Hattie, 1999) which are attributable to the specific interventions or methods being researched– changes beyond natural maturation or chance.
- Blatantly obvious effects: An effect-size of d=1.0 indicates an increase of one standard deviation… A one standard deviation increase is typically associated with advancing children’s achievement by two to three years*, improving the rate of learning by 50%, or a correlation between some variable (e.g., amount of homework) and achievement of approximately r=0.50. When implementing a new program, an effect-size of 1.0 would mean that, on average, students receiving that treatment would exceed 84% of students not receiving that treatment. Cohen (1988) argued that an effect size of d=1.0 should be regarded as a large, blatantly obvious, and grossly perceptible difference [such as] the difference between a person at 5’3″ (160 cm) and 6’0″ (183 cm)—which would be a difference visible to the naked eye.
Effect Size CAUTION
Reduce temptation to oversimplify. This is one more resource in our efforts to problem-solve on behalf of our students. We need to be careful about drawing too definite a conclusion from an effect size without examining the study. For example, homework is shown to have an overall effect size of 0.29, which is low and well below the average of 0.40. But when you look more closely, you find that primary students gain least from homework (d = 0.15) while secondary students have greater gains (d = 0.64).
Editor’s Note
Data is only as useful as its application. As hinted at above, don’t fall into the trap of assuming the teaching and learning strategies and other impacts on student achievement at the top of the list are ‘bad’ and those at the bottom are ‘good.’ These are not recommendations, but rather a comprehensive synthesis of a huge amount of data. Every study has a story, and every strategy and impacting agent below has a background.
The most helpful part of this chart–and the reason we asked Dana to share her work here–was the column on the right where she adds a short statement or tidbit that helped contextualize the data point. Otherwise, judging purely by the chart, inquiry-based learning. self-directed learning, class size, and teacher content knowledge perform terribly while skipping a year, reciprocal teaching, and teaching of study skills are through the roof.
Ultimately, to best use this data to inform teaching and planning, every study should be analyzed on its own. We would need to clarify what the terms were for success. We’d also need to plainly clarify the definition for every word and phrase for every impacting agent and strategy so that we were all speaking the same language. We would then need to identify and analyze other variables in each study–inquiry with or without technology, with or without access to local communities, with students reading at, below, and above grade level, using culturally relevant or irrelevant text, and so on.
Which makes two of his books–Visible Learning and the Science of How We Learn, and Visible Learning: A Synthesis of Over 800 Meta-Analyses Relating to Achievement–must-buys so that you can do that kind of analysis on your own rather than skimming a blog post and extracting misguided takeaways (which is why we hesitated to publish it to begin with). That said, the results of the synthesizing of the data appear below.
Also, we used a new embedding host for the document. If you have trouble viewing or scrolling, let us know in comments, via email, or on twitter!
What Has The Greatest Influence On Learning? A Synthesis Of Hattie’s Index of Teaching & Learning Strategies
See below for effect sizes and context/explanation.
- Retention (holding back a year)
- Open vs traditional learning spaces
- Student control over learning
- Teacher subject matter knowledge
- Ability grouping/tracking/streaming
- Gender (male compared with female achievement)
- Matching teaching with student learning styles
- Within-class grouping
- Extra-Curricular
- Reducing class size
- Individualized instruction
- School finance
- Teaching test-taking and coaching
- Homework
- Inquiry-based teaching
- Using simulations and gaming
- Decreasing disruptive behavior
- Computer-assisted instruction
- Integrated curricular programs
- How to develop high expectations for each teacher
- Professional development on student achievement
- Home environment
- Peer influences on achievement
- Phonics instruction
- Providing worked examples
- Cooperative vs individualistic learning
- Direct instruction
- Concept mapping
- Comprehension programs
- Teaching learning strategies
- Teaching study skills
- Vocabulary programs
- How to accelerate learning (e.g. skipping a year)
- How to better teach meta-cognitive strategies
- Teacher-student relationships
- Reciprocal teaching
- How to provide better feedback
- Providing formative evaluation to teachers
- Teacher credibility in the eyes of the students
Hattie’s index
Hattie’s index
